%%
> Published `=dateformat(this.created, "MMM dd, yyyy")`
%%
> Published Mar 03, 2025
# AutoGen - A Modern AI Agent Framework for Multi‑Agent Collaboration
Large Language Model (LLM) **agents** have exploded in popularity, enabling AI to carry out tasks autonomously or with minimal human guidance. Early frameworks like **LangChain** helped developers connect LLMs with tools and data, but they have grown increasingly complex over time. Enter **AutoGen** – an open-source framework from Microsoft designed to make building multi-agent AI systems simpler and more elegant. In this tutorial, we’ll explore AutoGen’s background and key features, compare it with LangChain, and walk through a practical example of multiple AI agents collaborating (with streaming responses).
## Why AutoGen?

AutoGen was developed by Microsoft to simplify the creation of AI workflows involving **multiple agents**. In AutoGen, an _agent_ is any entity that can send and receive messages and generate replies using an LLM, tools, or even human input. The philosophy is that complex tasks can be tackled by a team of specialized agents working together, rather than a single monolithic agent. This multi-agent approach draws on the latest research in agent collaboration and has proven effective in many domains from customer support and data analysis to robotics and education.
**Why was AutoGen created?** One reason is to overcome the rigidity of earlier frameworks. LangChain, for example, provided many building blocks for LLM apps but enforced structured workflows that could become limiting. As one analysis noted, LangChain’s heavy abstractions sometimes _make LLM development more complex than necessary_. By late 2024, it was clear that a more flexible, agent-centric framework could better accommodate new ideas (like agents talking to agents) without the bloat. AutoGen was born to fill this gap, offering an _agentic AI_ framework where “the whole is greater than the sum of its parts” – i.e. multiple agents collaborating can achieve more than any single agent alone.
## AutoGen vs. LangChain (Modern Simplicity vs. Growing Complexity)
**LangChain** deserves credit for popularizing LLM pipelines. It’s powerful and comes with a rich ecosystem of integrations (for vector databases, tools, memory, etc.). However, many developers have found that **LangChain’s complexity has grown over time**, making it harder to customize or innovate beyond its predefined patterns. It also has too many breaking changes as it evolves. Additionally, LangChain’s “chain” paradigm, while great for sequential tasks, can feel dated for interactive or dynamic agent scenarios. In fact, implementing multiple agents that converse or reason together in LangChain often requires intricate workarounds.
**AutoGen**, on the other hand, was designed with multi-agent conversations in mind from the start. It treats a workflow as a conversation between agents, not a hard-coded sequence of steps.
This leads to a simpler, more intuitive developer experience. For example, you can spin up a few agents and let them figure out how to solve a task collectively – AutoGen handles the messaging, scheduling, and orchestration behind the scenes. The framework favors **elegance and minimalism**: common tasks require only a few lines of code, and the abstractions are closer to how we think about cooperative AI (agents that “chat” with each other) rather than forcing everything into chains or callbacks. In short, LangChain is powerful but increasingly unwieldy, whereas AutoGen offers a refreshingly **simple and modern approach** to building agent systems.
## Key Features of AutoGen
AutoGen comes with a number of features that make it a joy to use for intermediate and advanced AI developers:
- **Multi-Agent Conversation Framework** – AutoGen provides a high-level abstraction for orchestrating conversations among multiple agents. You can have AI assistants, tool-using agents, and even human participants all exchanging messages in a shared conversation to solve a problem collectively. This _automated chat_ paradigm simplifies the workflow and boosts the overall LLM performance by leveraging each agent’s strengths.
- **Simplicity and Minimal Code** – Setting up agents and conversations is extremely straightforward. In many cases, you only need to instantiate a couple of agent classes and start the chat. The framework automates task orchestration and context management, so you **write far less boilerplate** compared to other frameworks. This makes rapid prototyping and iteration much faster.
- **Customizable & Extensible Agents** – AutoGen comes with built-in agent types (more on these below) and allows you to customize their behavior or create new ones. Agents can integrate **multiple LLMs, tools, or even human input** as needed. For example, an agent could use GPT-4 for general reasoning, a Python tool for calculations, and fall back to a human for validation – all within one framework. This composability means you can tailor agents to complex workflows without reinventing the wheel.
- **Asynchronous and Streaming Support** – Unlike older synchronous call patterns, AutoGen’s agents communicate via asynchronous messages in the latest versions. This means agents don’t block each other; they can work in parallel or wait for events. Crucially, it also enables **streaming responses** – as an agent generates a reply (say, a long explanation), you can stream partial results to the user in real-time. This improves responsiveness in interactive applications.
- **Autonomous or Human-in-the-Loop** – AutoGen supports both fully autonomous agent operation and configurable human involvement. You can run agents 100% hands-free (useful for automation), or set certain agents to require confirmation or input from a human at specific steps. This flexibility is important for enterprise use-cases where oversight is needed.
- **Integrated Tools and Skills** – The framework makes it easy to give agents extra capabilities. For instance, you can attach a code execution module so an agent can write and run Python code, or a web-browsing module so an agent can fetch live information. Many such “skills” can be plugged in out-of-the-box or via extensions. AutoGen also provides helpful features like caching LLM responses, managing long context, and error handling to optimize agent runs.
- **Cross-Language and Ecosystem** – While Python is currently the most mature implementation, AutoGen is also being developed for .NET, and the architecture supports interoperability between languages. It’s a community-driven project with contributors from Microsoft Research and beyond, and it aligns with Microsoft’s **Semantic Kernel** for enterprise AI integration. An entire ecosystem is forming around AutoGen, including benchmarking tools (AutoGen Bench) and a visual builder (AutoGen Studio).
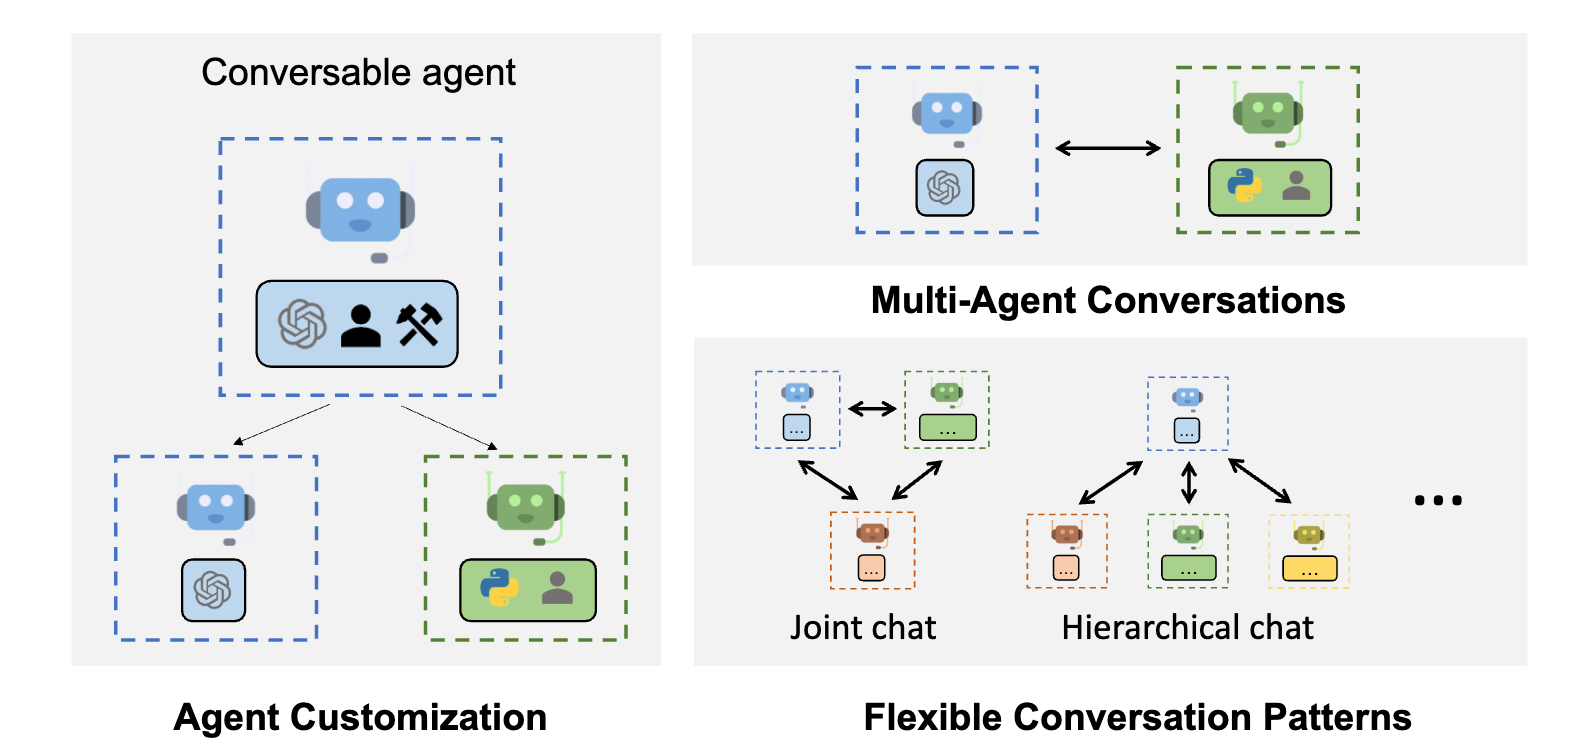
AutoGen defines a base `ConversableAgent` with specialized subclasses for different roles. For example, `AssistantAgent` (blue) is an AI assistant using LLMs with no human input, `UserProxyAgent` (green) simulates a human user (and can execute code on the user’s behalf), and `GroupChatManager` (red) can coordinate a group of agents. This object-oriented design makes it easy to set up multi-agent conversations by simply instantiating the appropriate agents and letting them message each other.
## Example: Building an AutoGen-Based Stock Analysis System
> Disclaimer: this will not replace real Financial advisor and it is only for demo purposes. Stock Analysis System may not be accurate
**source code in [GitHub](https://github.com/pakbaz/FinancialAdvisor)**
Analyzing a stock involves looking at both **fundamental factors** (like earnings and valuation) and **technical indicators** (like price trends and momentum). In this tutorial, we’ll develop a multi-agent financial analysis system using the **AutoGen** framework. The system will accept a stock ticker (e.g. "AAPL") as input, have different agents fetch and analyze data, and then produce insights in text _and_ chart format with a clear buy/hold/sell recommendation. We’ll walk through the implementation step-by-step, with code snippets and explanations for each part.
## Overview of the Multi-Agent Approach
Our system will consist of **four specialized AI agents**, each with a distinct role:
- **Data Fetcher Agent** – retrieves fundamental and technical data for the given stock from the **Alpha Vantage** API (a free service for real-time and historical market data e.g. price, P/E ratio, EPS, market cap, moving averages, RSI, etc.).
- **Fundamental Analysis Agent** – interprets fundamental metrics (like P/E ratio vs. EPS) to assess valuation and financial health.
- **Technical Analysis Agent** – examines technical indicators (moving average crossover, RSI levels, Bollinger Bands) to gauge market momentum and trends.
- **Recommendation Agent** – aggregates the insights and provides a final recommendation: **Strong Buy**, **Hold**, or **Sell**, based on predefined decision logic (positive fundamentals + positive technicals = buy, mixed signals = hold, both negative = sell).
Using **AutoGen**, these agents will communicate in a conversation, each contributing their analysis. We’ll orchestrate this conversation such that their responses stream progressively (simulating real-time analysis). Finally, we’ll combine their outputs into a summary report containing written insights and a chart visualization of the stock’s technical trend. Let’s dive into the implementation in four steps:
## 1. Creating the Agent Roles with AutoGen
First, we define each agent and its capabilities. AutoGen provides an `AssistantAgent` class for creating AI agents with specific tools and behaviors. We’ll use this to set up our Data Fetcher, Fundamental Analyst, Technical Analyst, and Recommendation agent. Each agent can be given:
- A **name** and **description** for clarity.
- A **system prompt/message** that defines its role and how it should behave.
- Optionally, a set of **tools** (functions it can call) to extend its capabilities (for example, to fetch data or perform calculations).
For the LLM backbone, our system uses GPT-4 as the model. The implementation supports both OpenAI and Azure OpenAI clients – if Azure credentials are configured, the code will automatically use the Azure OpenAI service by default, otherwise it falls back to the OpenAI API. This flexible setup allows the application to run with whichever service is available.
The Data Fetcher will use **Alpha Vantage** to get stock data. We can integrate a tool function (using the Alpha Vantage API via its Python library) to retrieve the necessary info. For example, the function might return a dictionary of key metrics (current price, P/E ratio, EPS, market cap, 50-day MA, 200-day MA, RSI, Bollinger Bands values, etc.). Below, we create the data fetcher agent and give it a `fetch_stock_data` tool:
```python
import os
from alpha_vantage.timeseries import TimeSeries
from alpha_vantage.fundamentaldata import FundamentalData
from autogen_core.tools import FunctionTool
from autogen_agentchat.agents import AssistantAgent
from autogen_ext.models.openai import OpenAIChatCompletionClient
# Define a tool function to fetch stock data from Alpha Vantage
def fetch_stock_data(ticker: str) -> dict:
api_key = os.environ.get("ALPHA_VANTAGE_API_KEY")
if not api_key:
raise ValueError("ALPHA_VANTAGE_API_KEY not set in environment")
ts = TimeSeries(key=api_key, output_format='pandas')
fd = FundamentalData(key=api_key, output_format='pandas')
# Fetch daily price data
data, _ = ts.get_daily(symbol=ticker, outputsize='full')
data = data.sort_index()
close_prices = data['4. close']
# Calculate technical indicators (50-day MA, 200-day MA, RSI, Bollinger Bands)
ma50 = close_prices.rolling(window=50).mean().iloc[-1] # latest 50-day MA
ma200 = close_prices.rolling(window=200).mean().iloc[-1] # latest 200-day MA
# Simple RSI calculation (14-day)
delta = close_prices.diff().dropna()
gain = delta.where(delta > 0, 0).rolling(window=14).mean().iloc[-1]
loss = -delta.where(delta < 0, 0).rolling(window=14).mean().iloc[-1]
rsi = 100 - (100 / (1 + (gain / loss))) if loss != 0 else 100
# Bollinger Bands (20-day MA ± 2 std dev)
ma20 = close_prices.rolling(window=20).mean().iloc[-1]
std20 = close_prices.rolling(window=20).std().iloc[-1]
upper_band = ma20 + 2 * std20
lower_band = ma20 - 2 * std20
# Fundamentals from company overview
overview, _ = fd.get_company_overview(symbol=ticker)
pe_ratio = float(overview['PERatio'].iloc[0])
eps = float(overview['EPS'].iloc[0])
market_cap = float(overview['MarketCapitalization'].iloc[0])
return {
"current_price": close_prices.iloc[-1],
"market_cap": market_cap,
"pe_ratio": pe_ratio,
"eps": eps,
"50d_ma": float(ma50) if ma50 else None,
"200d_ma": float(ma200) if ma200 else None,
"rsi": float(rsi),
"bollinger_upper": float(upper_band),
"bollinger_lower": float(lower_band)
}
# Wrap the function in an AutoGen tool
fetch_tool = FunctionTool(fetch_stock_data, description="Fetch fundamental and technical data for a stock ticker from Alpha Vantage")
# Create the Data Fetcher agent
data_agent = AssistantAgent(
name="Data_Fetcher",
model_client=OpenAIChatCompletionClient(model="gpt-4"),
tools=[fetch_tool],
description="Fetches fundamental & technical data from Alpha Vantage for a given stock ticker.",
system_message=(
"You are a data fetching agent. Given a stock ticker, use the provided tool "
"to retrieve the stock's fundamental and technical metrics. "
"Return the data as a summary including current price, market cap, P/E ratio, EPS, moving averages, RSI, and Bollinger Bands."
)
)
```
In this snippet, the Data Fetcher’s system prompt instructs it to use the `fetch_stock_data` tool to get the required info. The **P/E ratio** (price-to-earnings) is one key fundamental metric – it’s the stock’s price divided by its earnings per share. We also fetch **EPS** (earnings per share) and **market cap** (share price times shares outstanding, indicating the company’s size). On the technical side, we calculate:
- **50-day and 200-day Moving Averages (MA)** – used to identify trends. (A short-term MA crossing above a long-term MA is a bullish signal, and vice versa)
- **Relative Strength Index (RSI)** – a momentum oscillator on a 0-100 scale; traditionally, RSI > 70 indicates an overbought condition and RSI < 30 indicates oversold.
- **Bollinger Bands** – volatility bands at ±2 standard deviations from a 20-day MA. If price touches the upper band repeatedly, the stock may be **overbought**, whereas touching the lower band suggests **oversold** (potential buy signal).
> **Note:** In a real implementation, you’d ensure error handling for cases like missing data or a new ticker with insufficient history. The above calculations are simplified for clarity.
### Fundamental Analysis Agent
Next, we create the Fundamental Analysis agent. This agent will **not** need an external tool; it will receive the data from the Data Fetcher (via the conversation) and then analyze metrics like P/E, EPS, and market cap to derive insights. For example, it might comment on whether the P/E is high or low relative to the industry (high P/E can mean overvaluation or high growth expectations) and whether the company’s earnings (EPS) are strong.
We configure this agent with a descriptive prompt about its role:
```python
# Create the Fundamental Analysis agent
fundamental_agent = AssistantAgent(
name="Fundamental_Analyst",
model_client=OpenAIChatCompletionClient(model="gpt-4"),
description="Analyzes the stock's fundamentals like P/E ratio, EPS, and market cap to determine valuation.",
system_message=(
"You are a fundamental analysis expert. Given the stock's fundamental data, analyze the P/E ratio, EPS, and market cap to assess "
"whether the stock is undervalued, fairly valued, or overvalued. Provide your analysis in a concise manner."
)
)
```
Here we instruct the agent to focus on fundamentals. For instance, if the agent sees a **P/E ratio** of 15 and strong EPS growth, it might conclude the stock is reasonably valued or undervalued relative to earnings. If the **P/E** is extremely high (say 100+), it could warn that the stock might be overpriced unless huge growth is expected. The agent can also note the **market capitalization** (for context of company size) and any other fundamental info (like sector, if provided). We rely on the language model’s knowledge and the data to draw these conclusions.
### Technical Analysis Agent
The Technical Analysis agent will examine trend and momentum indicators from the stock data. Its task is to interpret things like:
- **Moving Average crossover**: e.g., if the 50-day MA is above the 200-day MA, that’s generally bullish (known as a “Golden Cross”); if it’s below (a “Death Cross”), that’s bearish.
- **RSI value**: e.g., RSI near 50 is neutral, >70 suggests overbought (price may have run up too far too fast), <30 suggests oversold (price may rebound).
- **Bollinger Bands**: e.g., price breaking above the upper band can mean strong momentum (but possibly overbought), whereas touching the lower band could signal a potential bottom.
We set up the technical analyst agent with instructions to discuss these:
```python
# Create the Technical Analysis agent
technical_agent = AssistantAgent(
name="Technical_Analyst",
model_client=OpenAIChatCompletionClient(model="gpt-4"),
description="Analyzes technical indicators (moving averages, RSI, Bollinger Bands) to determine the stock's trend and momentum.",
system_message=(
"You are a technical analysis expert. Evaluate the stock's technical data including the 50-day and 200-day moving averages, "
"RSI, and Bollinger Bands to determine the stock's trend and momentum. Provide your analysis clearly and concisely."
)
)
```
This prompt guides the agent to look for signals. For example, the agent might observe: “The 50-day MA is **above** the 200-day MA, indicating an uptrend (a possible Golden Cross occurred). The RSI is around 55, which is neutral – not overbought or oversold. The stock is trading near the upper Bollinger Band but not breaking above it, indicating moderate bullish momentum.” Such an assessment would be a **positive technical outlook**. On the other hand, if the 50-day was below the 200-day and RSI was, say, 25, the agent would note a **bearish** trend and oversold condition.
### Recommendation Agent
Finally, the Recommendation agent will listen to both the fundamental and technical analyses and make a decision on what the investor should do. We want this agent to output a clear recommendation:
- **Strong Buy** if the fundamentals are solid _and_ technicals are positive.
- **Hold** (a cautious stance) if there are mixed signals (e.g. good fundamentals but weak technical trend, or vice versa).
- **Sell** if fundamentals look poor and technical indicators are bearish.
We’ll encode these rules in the agent’s instructions. While we could attempt to have the agent explicitly check conditions, we can rely on the natural language understanding of the model to interpret phrases from the other agents. For example, the fundamental agent might use words like “undervalued” or “strong earnings” and the technical agent might say “uptrend” or “bullish crossover.” The recommendation agent can pick up on those cues. We will, however, include guidance on what constitutes each recommendation category:
```python
# Create the Recommendation agent
recommendation_agent = AssistantAgent(
name="Recommendation_Agent",
model_client=OpenAIChatCompletionClient(model="gpt-4"),
description="Provides a final buy/hold/sell recommendation based on the combined fundamental and technical analyses.",
system_message=(
"You are a recommendation agent. Based on the provided fundamental and technical analyses, give a final recommendation for the stock: 'Strong Buy', 'Hold', or 'Sell'. "
"Use these criteria: if both fundamental and technical signals are strong, recommend 'Strong Buy'; if both are weak, recommend 'Sell'; otherwise, recommend 'Hold'. "
"Explain your reasoning briefly."
)
)
```
In this setup, the Recommendation agent’s system prompt explicitly outlines the logic. It references the general criteria for decisions:
- If both analysis agents are positive, it should lean **Strong Buy**.
- If both are negative, lean **Sell**.
- Otherwise, **Hold**.
For example, suppose the fundamental agent says _“P/E is low and EPS growth is strong, indicating the stock is undervalued”_ and the technical agent says _“the stock just had a golden cross and is in a steady uptrend”_. The recommendation agent should then respond with **“Strong Buy”** (with reasoning like “Fundamentals indicate undervaluation and technicals show a bullish trend, so it's a strong buy”). Conversely, if fundamentals mentioned overvaluation and technicals show a downtrend, a **Sell** is in order. Mixed cues (say, good fundamentals but the stock is currently overbought or in a short-term dip) might warrant a **Hold** recommendation.
With all four agents defined, we have our team ready to collaborate. Now we need to set up the conversation orchestration.
## 2. Orchestrating the Multi-Agent Conversation
AutoGen simplifies the process of getting these agents to talk to each other. We will use a **Group Chat** orchestration where the agents take turns responding in sequence. A simple round-robin approach ensures each agent contributes once per cycle. In our case, one cycle of responses (four turns) is sufficient to cover Data Fetcher -> Fundamental -> Technical -> Recommendation.
We’ll configure the group chat manager to limit the conversation to one full round of each agent (since that’s enough for our needs). Here’s how to set up and run the chat:
```python
from autogen_agentchat.teams import RoundRobinGroupChat
# Create a group chat with the four agents in a round-robin fashion
agents = [data_agent, fundamental_agent, technical_agent, recommendation_agent]
team = RoundRobinGroupChat(agents, max_turns=4) # each agent will respond once, total 4 turns
# Define the user query/task
ticker = input("Enter a stock ticker (e.g., AAPL): ").strip().upper()
user_task = f"Analyze the stock {ticker} and provide a buy/hold/sell recommendation along with fundamental and technical insights."
# Initiate the multi-agent conversation (streaming mode)
stream = team.run_stream(task=user_task)
```
A few things to note:
- We set `max_turns=4` to ensure the conversation stops after the Recommendation agent’s turn. (Each agent will speak once in order. We have 4 agents, so 4 turns.)
- The `task` passed in is the user’s prompt. In this case, _“Analyze the stock AAPL and provide a buy/hold/sell recommendation with fundamental and technical insights.”_ The Data Fetcher is first in the list, so it will receive this prompt along with the system message we gave it. It knows to use its tool to get data.
- The `team.run_stream(...)` call will produce an asynchronous stream of messages as the chat progresses. We use streaming so that we can output each agent’s answer in real-time. At this point, the agents will begin “chatting” in sequence. However, to actually see the output as it happens, we need to consume the `stream`.
## 3. Streaming the Analysis in Real-Time
In a live application, you might want the user to see each part of the analysis as soon as it’s available (rather than waiting for the final answer). AutoGen’s `run_stream` provides a way to iterate over partial results. We can use the `Console` utility to print messages as they arrive, or manually iterate through the stream. For simplicity, let’s use the provided `Console` class, which will display the streaming responses in the console. We’ll run this within an asynchronous context:
```python
import asyncio
from autogen_agentchat.ui import Console
# Function to stream the conversation to console
async def stream_conversation():
await Console(stream)
# Run the streaming output
asyncio.run(stream_conversation())
```
When you run the above, you would see something like the following sequence appear step by step (simulated here for illustration):
- **User**: _"Please analyze the stock AAPL and provide a buy/hold/sell recommendation."_
- **Data_Fetcher**: _"Fetching data for AAPL... Current Price: $150, P/E: 28, EPS: 5.2, Market Cap: $2.4T. 50-day MA: $148, 200-day MA: $140, RSI: 55, Bollinger Bands: [$135, $155]."_ (This agent gathered the raw stats; P/E of ~28 and EPS $5.2, etc.)
- **Fundamental_Analyst**: _"AAPL’s P/E ratio of 28 indicates the stock is priced at 28 times its earnings. This is somewhat high, but not unusual for a tech giant with consistent earnings growth. The company’s strong EPS of $5.2 and massive market cap suggest robust profitability and a dominant market position. Overall, fundamentals appear solid with the valuation in a reasonable range given Apple’s growth."_
- **Technical_Analyst**: _"Apple’s 50-day moving average ($148) is above its 200-day moving average ($140), reflecting an **uptrend** (the stock experienced a “Golden Cross” some time ago). The RSI is around 55, which is neutral – not overbought (below the 70 level) and not oversold. The stock is near the upper Bollinger Band but not breaking out, indicating moderate bullish momentum without extreme volatility. Technical signals for AAPL are largely positive/bullish."_
- **Recommendation_Agent**: _"**Strong Buy:** Apple’s fundamentals are strong (solid earnings and a reasonable P/E ratio) and technical indicators confirm an upward momentum. The uptrend and healthy RSI suggest further upside potential, aligning with the company’s robust financial position. Therefore, it’s a strong buy recommendation."_
As shown, each agent’s message is streamed in turn. The system has effectively broken down the problem: one agent gathered data, two analyzed it from different angles, and the last agent made a decision. The final recommendation here was **“Strong Buy”** because both the fundamental and technical outlooks were positive. If the signals were mixed, the Recommendation agent might have said **“Hold”**, and if both were negative, **“Sell.”** For instance, if the Data Fetcher returned a very high P/E and the technicals showed a downtrend (50-day < 200-day, RSI high or dropping), the fundamental analyst would highlight overvaluation and the technical analyst would note weakness, leading the final agent to likely say _“Sell: The stock appears overvalued and in a downtrend.”_
## 4. Generating Chart Visualizations and Final Insights
In addition to text, it’s often useful to provide a **chart** to the user, especially for technical analysis. We can have the system generate a chart of the stock’s price with indicators. One approach is to have the Technical Analysis agent (or a dedicated visualization agent) produce a chart using a plotting library like Matplotlib. The agent could output code to create a chart, which a tool or the user’s environment executes, and then include that chart image in the response.
For example, to plot the price history with the 50-day and 200-day moving averages and Bollinger Bands, we could use Python as follows:
```python
# --- Plotting Function ---
def plot_stock_data(data: dict, ticker: str):
hist = data["hist"]
close_prices = data["close_prices"]
# Calculate moving averages and Bollinger Bands for plotting
ma50 = close_prices.rolling(window=50).mean()
ma200 = close_prices.rolling(window=200).mean()
ma20 = close_prices.rolling(window=20).mean()
std20 = close_prices.rolling(window=20).std()
upper_band = ma20 + 2 * std20
lower_band = ma20 - 2 * std20
plt.figure(figsize=(12, 6))
plt.plot(hist.index, close_prices, label="Close Price", color="blue")
plt.plot(hist.index, ma50, label="50-day MA", color="green")
plt.plot(hist.index, ma200, label="200-day MA", color="red")
plt.plot(hist.index, upper_band, label="Upper Bollinger Band", color="orange", linestyle="--")
plt.plot(hist.index, lower_band, label="Lower Bollinger Band", color="orange", linestyle="--")
plt.fill_between(hist.index, lower_band, upper_band, color="gray", alpha=0.3)
plt.title(f"{ticker} Stock Price and Technical Indicators")
plt.xlabel("Date")
plt.ylabel("Price (USD)")
plt.legend()
plt.grid(True)
plt.tight_layout()
# Display the plot until the window is manually closed.
plt.show()
```
In the chart produced, you can see the **50-day MA crossing above the 200-day MA** (a classic **Golden Cross** event) which often precedes price rallies. Such visual context reinforces the Technical Analysis agent’s statements. If there was a **Death Cross** (50-day moving below 200-day), it would be a bearish sign. The chart also shows Bollinger Bands narrowing and widening with volatility, and one could observe if the price was touching the bands frequently (indicating potential overbought/oversold conditions as noted earlier).
Finally, the Recommendation agent’s output, along with the chart, can be compiled into a report for the user. For example, the final summary might be presented as:
- **Fundamental Insight:** _“The stock’s P/E ratio is moderate relative to earnings, and the company shows strong profitability (high EPS), suggesting the stock isn’t overvalued.”_
- **Technical Insight:** _“The 50-day MA is above the 200-day MA (uptrend) and RSI is not in overbought territory, indicating positive momentum.”_
- **Recommendation:** _“**Strong Buy** – Both fundamental valuation and technical trends are favorable. The company’s solid earnings and the bullish price momentum align, indicating a good opportunity to buy rather than hold or sell.”_
This structured approach gives a comprehensive view: the user sees the reasoning from multiple angles and a visual chart, rather than just a black-box answer.
## Conclusion
Through this tutorial, we built a multi-agent financial analysis system with AutoGen that: 1. **Fetched data** from Alpha Vantage API via a dedicated agent. 2. **Analyzed fundamentals and technicals** in parallel through specialized agents. 3. **Streamed the agents’ outputs** step-by-step to mimic a real-time collaborative analysis. 4. **Compiled a final recommendation** supported by textual insights and a chart.
This design can be extended further – for example, adding a **news analysis agent** to incorporate recent news sentiment, or a **risk assessment agent** to evaluate volatility and downside risk. The AutoGen framework makes it easy to plug in new agents and tools. By structuring the problem into clear roles, we get more transparent and expert analysis from each component, leading to a well-rounded answer for the end-user. Developers can use this pattern to integrate multi-agent AI workflows into their own finance applications, providing users with rich, explainable AI-driven insights.